Solutions

You don’t need the whole system on day one.

Three ways to use AmazeBase, depending on where the business is today — planning your first products, running a portfolio at scale, or managing accounts for other people.

For beginners

Start deciding before you start selling.

The planning and simulation modules work before you ship a single unit. No account to connect, no API keys, no waiting on data. Bring the research you already have and find out which idea is actually worth the money.

Planning & Product Research

Score the idea before you buy the inventory.

Upload the research you have already done and put every idea through the same test, so “this one feels good” becomes a number you can hold two products up against.

  • Four dimensions that decide it — discoverability, market size, competition and profitability, scored the same way every time
  • Build your own scoring system. Weight what matters to your business rather than accepting someone else’s definition of a good product
  • Compare products side by side instead of falling for whichever one you looked at most recently
  • Bring your own research. Import the exports you already have — nothing to connect, nothing to wait for

The point was never the score. It is knowing which of your ten ideas deserves the cash.
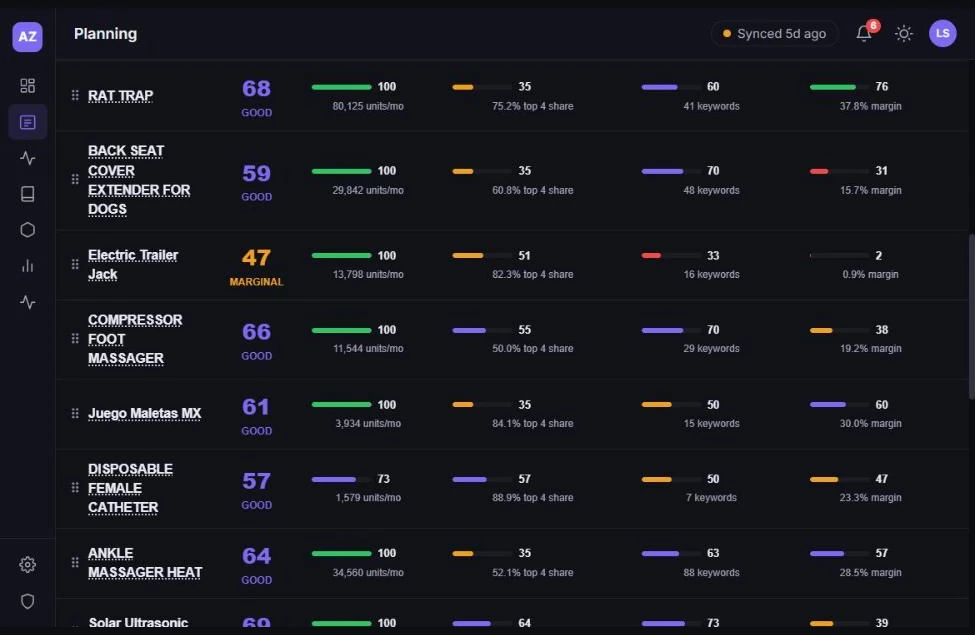
The Planning module scoring ten product ideas across market size, top-four share, keyword count and margin, each with a verdict of Good or Marginal
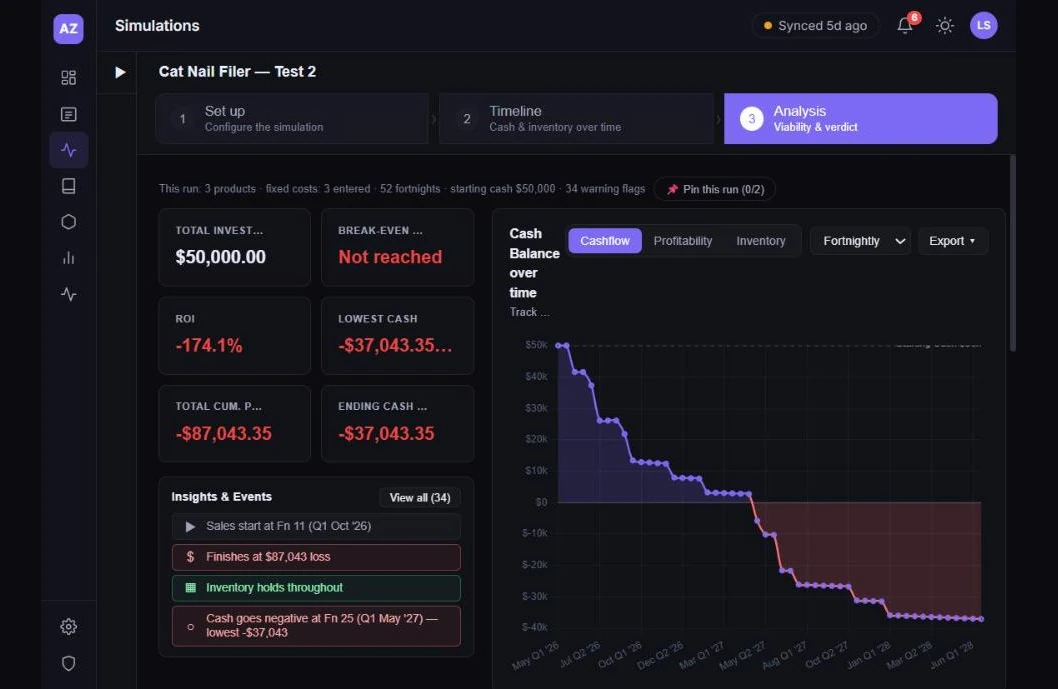
The Simulations module showing a run that fails: break-even not reached, ROI minus 174 percent, and a cash balance line falling below zero at fortnight 25 to a low of minus $37,043, with inventory holding throughout
Simulations

Find out whether you can afford the plan before you commit to it.

Model the launch forward from the cash you actually have — production, shipping, the sales ramp, the reorder — and watch where it holds and where it breaks.

  • How many products your cash can really carry, rather than how many you would like it to
  • When cash flow works and when it doesn’t, fortnight by fortnight
  • When to launch and when to wait — the same product can be a good idea in March and a bad one in November
  • Whether your own assumptions run you out of stock before the restock lands
  • Whether the profit is worth the risk you are taking to get it
  • Plan cash and launches months ahead, not one purchase order at a time

You can be profitable on paper and still run out of money. This is where you find that out while it is still free.

For experienced sellers

Every module, standing on the same number.

Connect your data and the modules stop behaving like separate tools. Landed cost feeds profit. Profit sets the break-even every ad decision is judged against. Ad decisions move inventory. Get that one number right and the whole system tells the truth.

Financials

Know what you made, and where it went.

A real P&L rebuilt from your settlements rather than your sales report — revenue, the full Amazon fee stack, what the goods actually cost you, ads, refunds and the overheads only you know about.

  • By month and by SKU, so a good month can’t hide a bad product
  • Two profit numbers — contribution and net — because they answer different questions
  • Amazon’s fees broken out, not collapsed into a single line you can’t argue with
  • Where the cash came from and where it went, traceable back to the row it came from
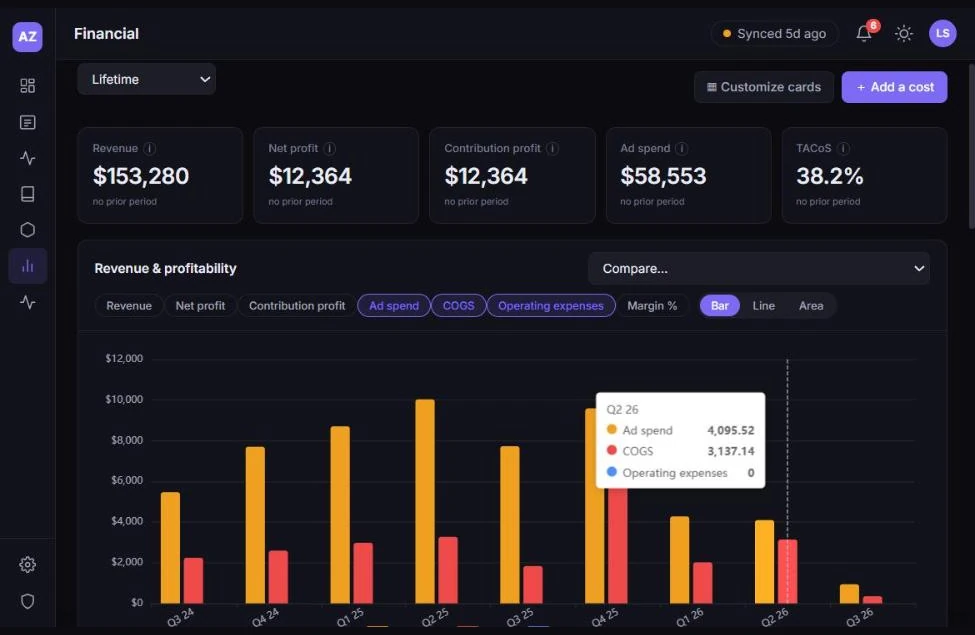
The Financial module showing revenue, net profit, contribution profit, ad spend and TACoS above a revenue and profitability chart broken out by quarter
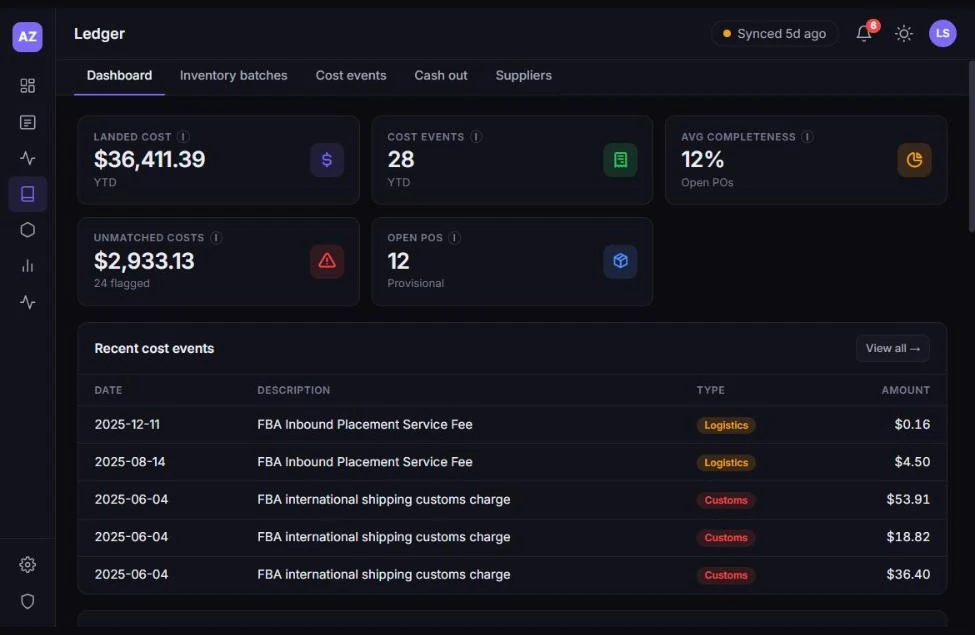
The Ledger module showing landed cost, cost events, open purchase orders and unmatched costs above a list of recent supplier and customs charges
Ledger

Every dollar it took to get the units here.

Purchase orders, freight, customs and duty, inspection, molds, tooling and design — assembled into a landed cost per unit you could defend to an accountant.

  • Every PO and where it actually is — manufacturing, freight, customs, inspection, received
  • Product and non-product costs together — transport, tax, molds, designers, samples, the things spreadsheets quietly drop
  • Landed cost per unit that arrived, not per unit you ordered
  • It knows what is missing — a freight invoice that never came in, and which PO it belongs to

This is the number the rest of the product is built on. Get it wrong and every profit figure downstream is fiction.

Inventory

Not “you’re low on stock.” The last day you can safely order.

Order-by dates, suggested quantities and real velocity, across every place your stock actually sits.

  • When to order and how many — stockout minus your lead time, not a threshold someone guessed
  • Sales velocity that reflects reality, including what advertising is propping up
  • FBA, AWD and 3PL in one view instead of three tabs and a mental note
  • Overdue said out loud — “overdue 14 days”, not a yellow dot you learn to ignore

Never run out of the product that was working.

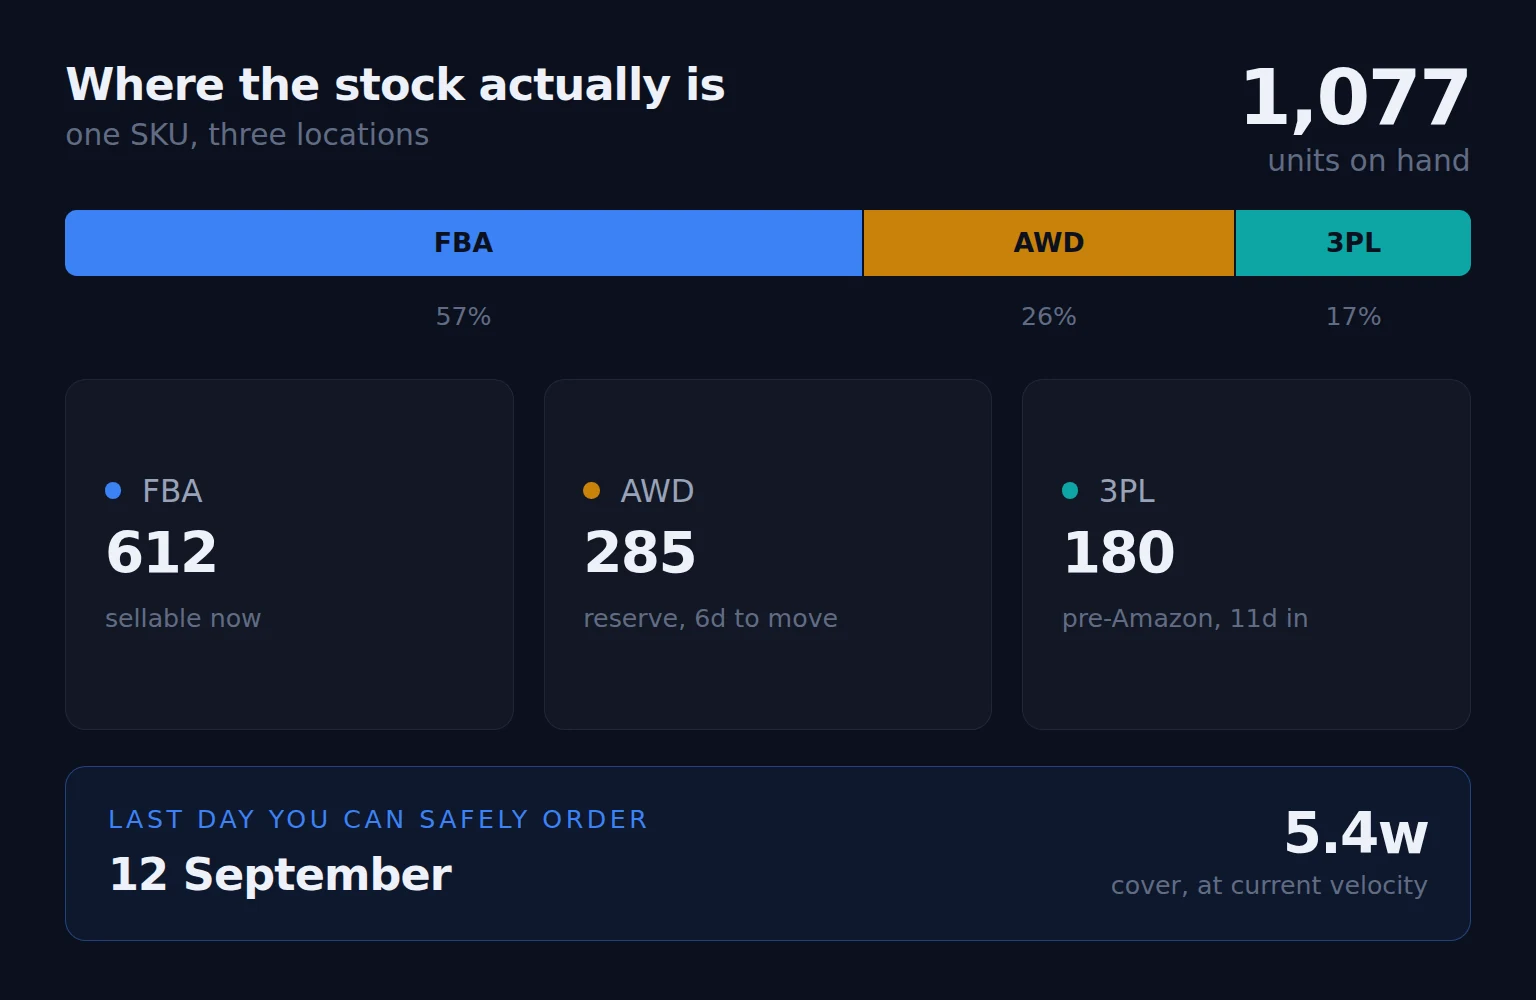
One SKU's stock split across FBA, AWD and 3PL as a single bar - 612 sellable now, 285 in reserve, 180 still pre-Amazon - above the last day it can safely be reordered
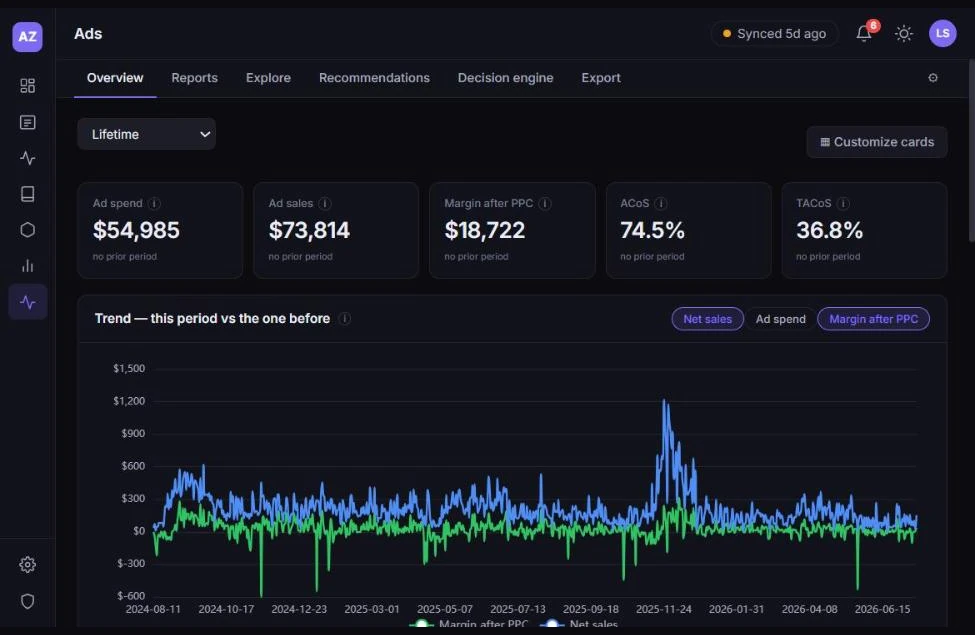
The Ads module showing ad spend, ad sales, margin after PPC, ACoS and TACoS above two years of daily net sales against margin
Ads console

PPC and organic, finally judged together.

Keywords, campaigns, placements, dayparting and brand analytics in one console — with the clicking automated and the decisions explained.

  • Break-even, not ACoS — every campaign judged against what that specific product can actually afford
  • Organic rank and organic sales next to the paid ones, so you can see what you are renting and what you own
  • Keywords, search terms, placements and dayparting in one place, with brand analytics alongside
  • The manual work automated — forty bid changes in one upload instead of an evening of clicking

Total control of PPC, minus the evenings.

For agencies

Every client, every marketplace, one console.

Run multiple accounts across multiple markets without rebuilding the same spreadsheet for each one — and give clients something they actually want to open.

Multi-account & multi-market

Switch clients without switching tools.

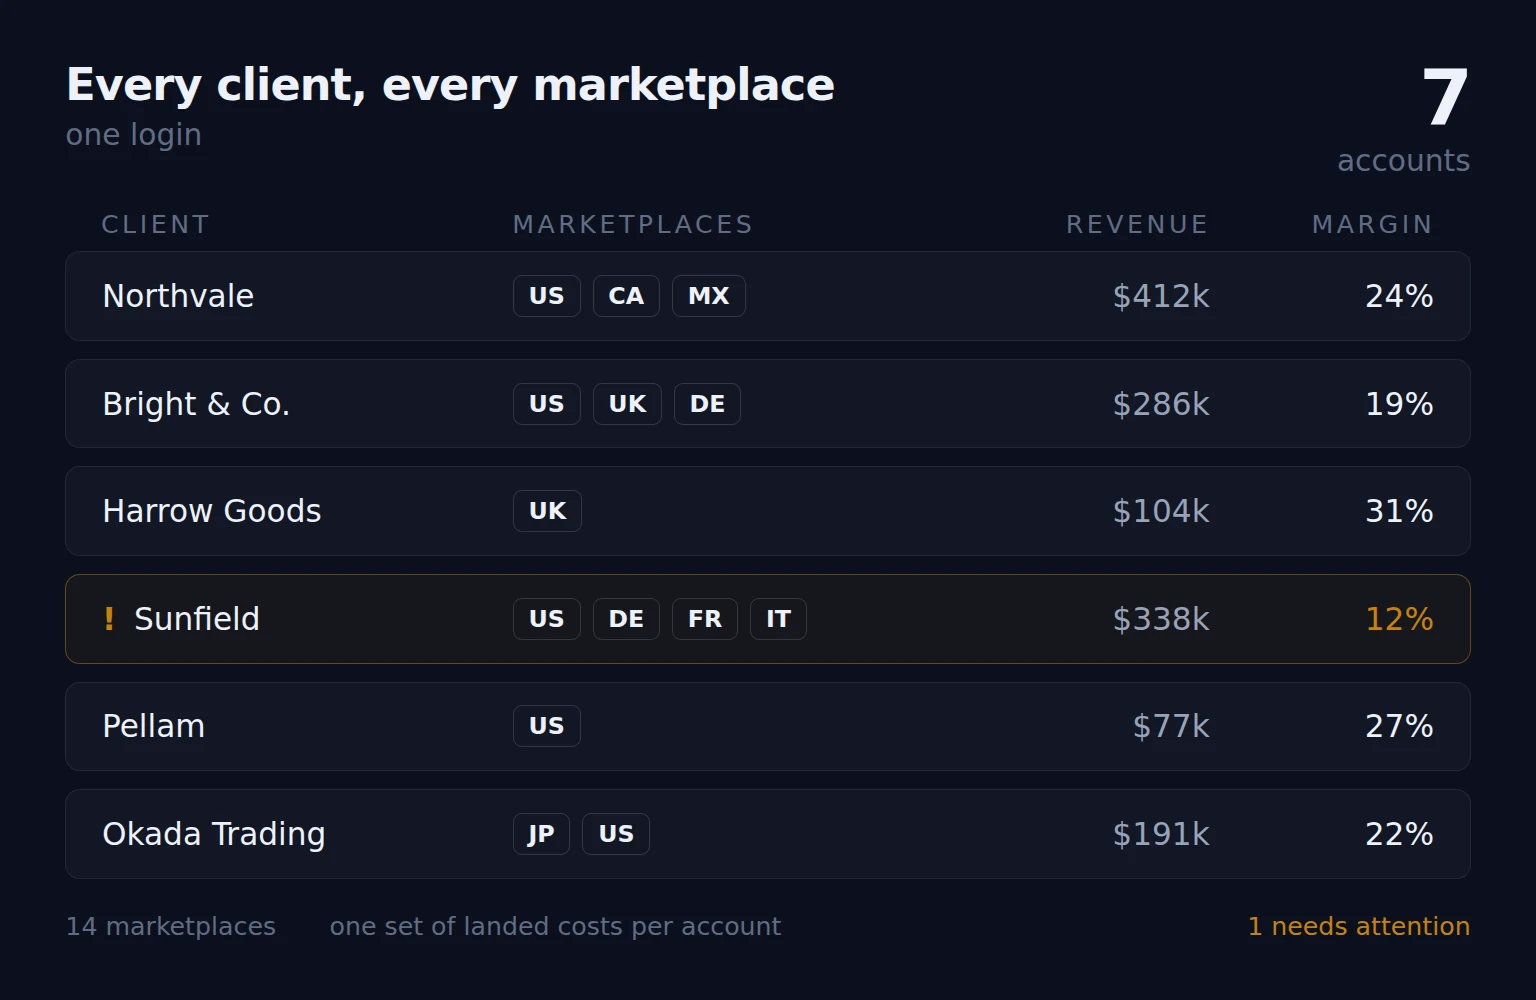
Every account you manage, in every marketplace it sells in, under one login — with the same numbers computed the same way for all of them.

  • Several accounts side by side, each with its own landed costs, fees and margins
  • Several marketplaces per account, with the currency and fee differences handled rather than ignored
  • Per-client access — give a client a window into their own account without giving them everyone else’s
  • Portfolio view or single client, whichever conversation you are in
Seven client accounts in one list, each with the marketplaces it sells in, its revenue and its margin, with one account flagged for attention
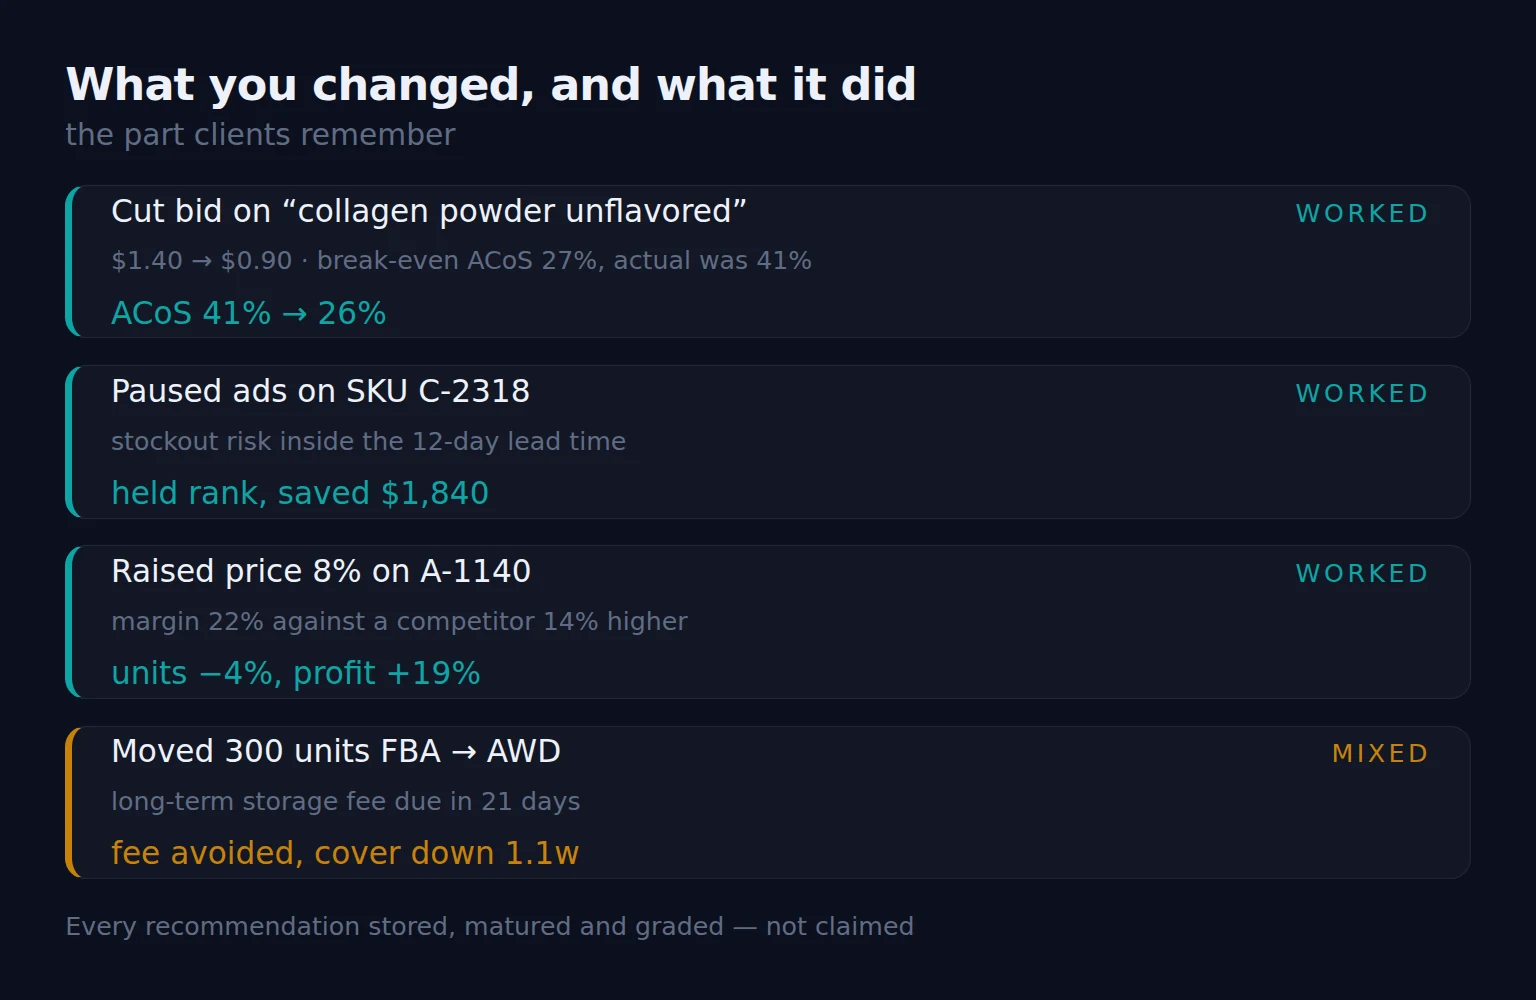
Four changes an agency made, each with the evidence behind it and the graded result: three marked worked, one mixed
Reporting & insight

Reports they read. Insights they remember.

Anyone can send a client a table of last month’s numbers. The renewal conversation is won by the agency that can say what it changed, why, and what happened next.

  • Client-ready reporting that goes past what happened to what you did about it
  • The evidence behind every recommendation, so the advice survives being questioned
  • Before and after on the changes you made — graded, not claimed
  • The insight nobody else is showing them — true landed margin, what advertising is really holding up, where the cash actually goes

Stop proving you were busy. Start proving you were right.

Whichever one you are, the questions are the same.

What is this actually making me? What should I do next? AmazeBase is built to answer those two, from your first product research to your fiftieth client account.

Join the Wait List
Early access

Join the wait list

We’ll email you when your marketplace opens up. No spam, and no payment details.